 Manta
MantaBaseline
Choose one process, period and source for the current result. Identify how data quality, seasonality and market changes could affect comparison.
EVIDENCE
Product references, illustrations and measured impact answer different questions. Here are the sources and what an engagement needs to evidence.
Selvaag Bolig describes using Plot.ai for analysis, pricing and assessment of potential projects.
Stian Møller KarlsenSales Manager, Selvaag Bolig ASA
Read the reference at Plot.ai ↗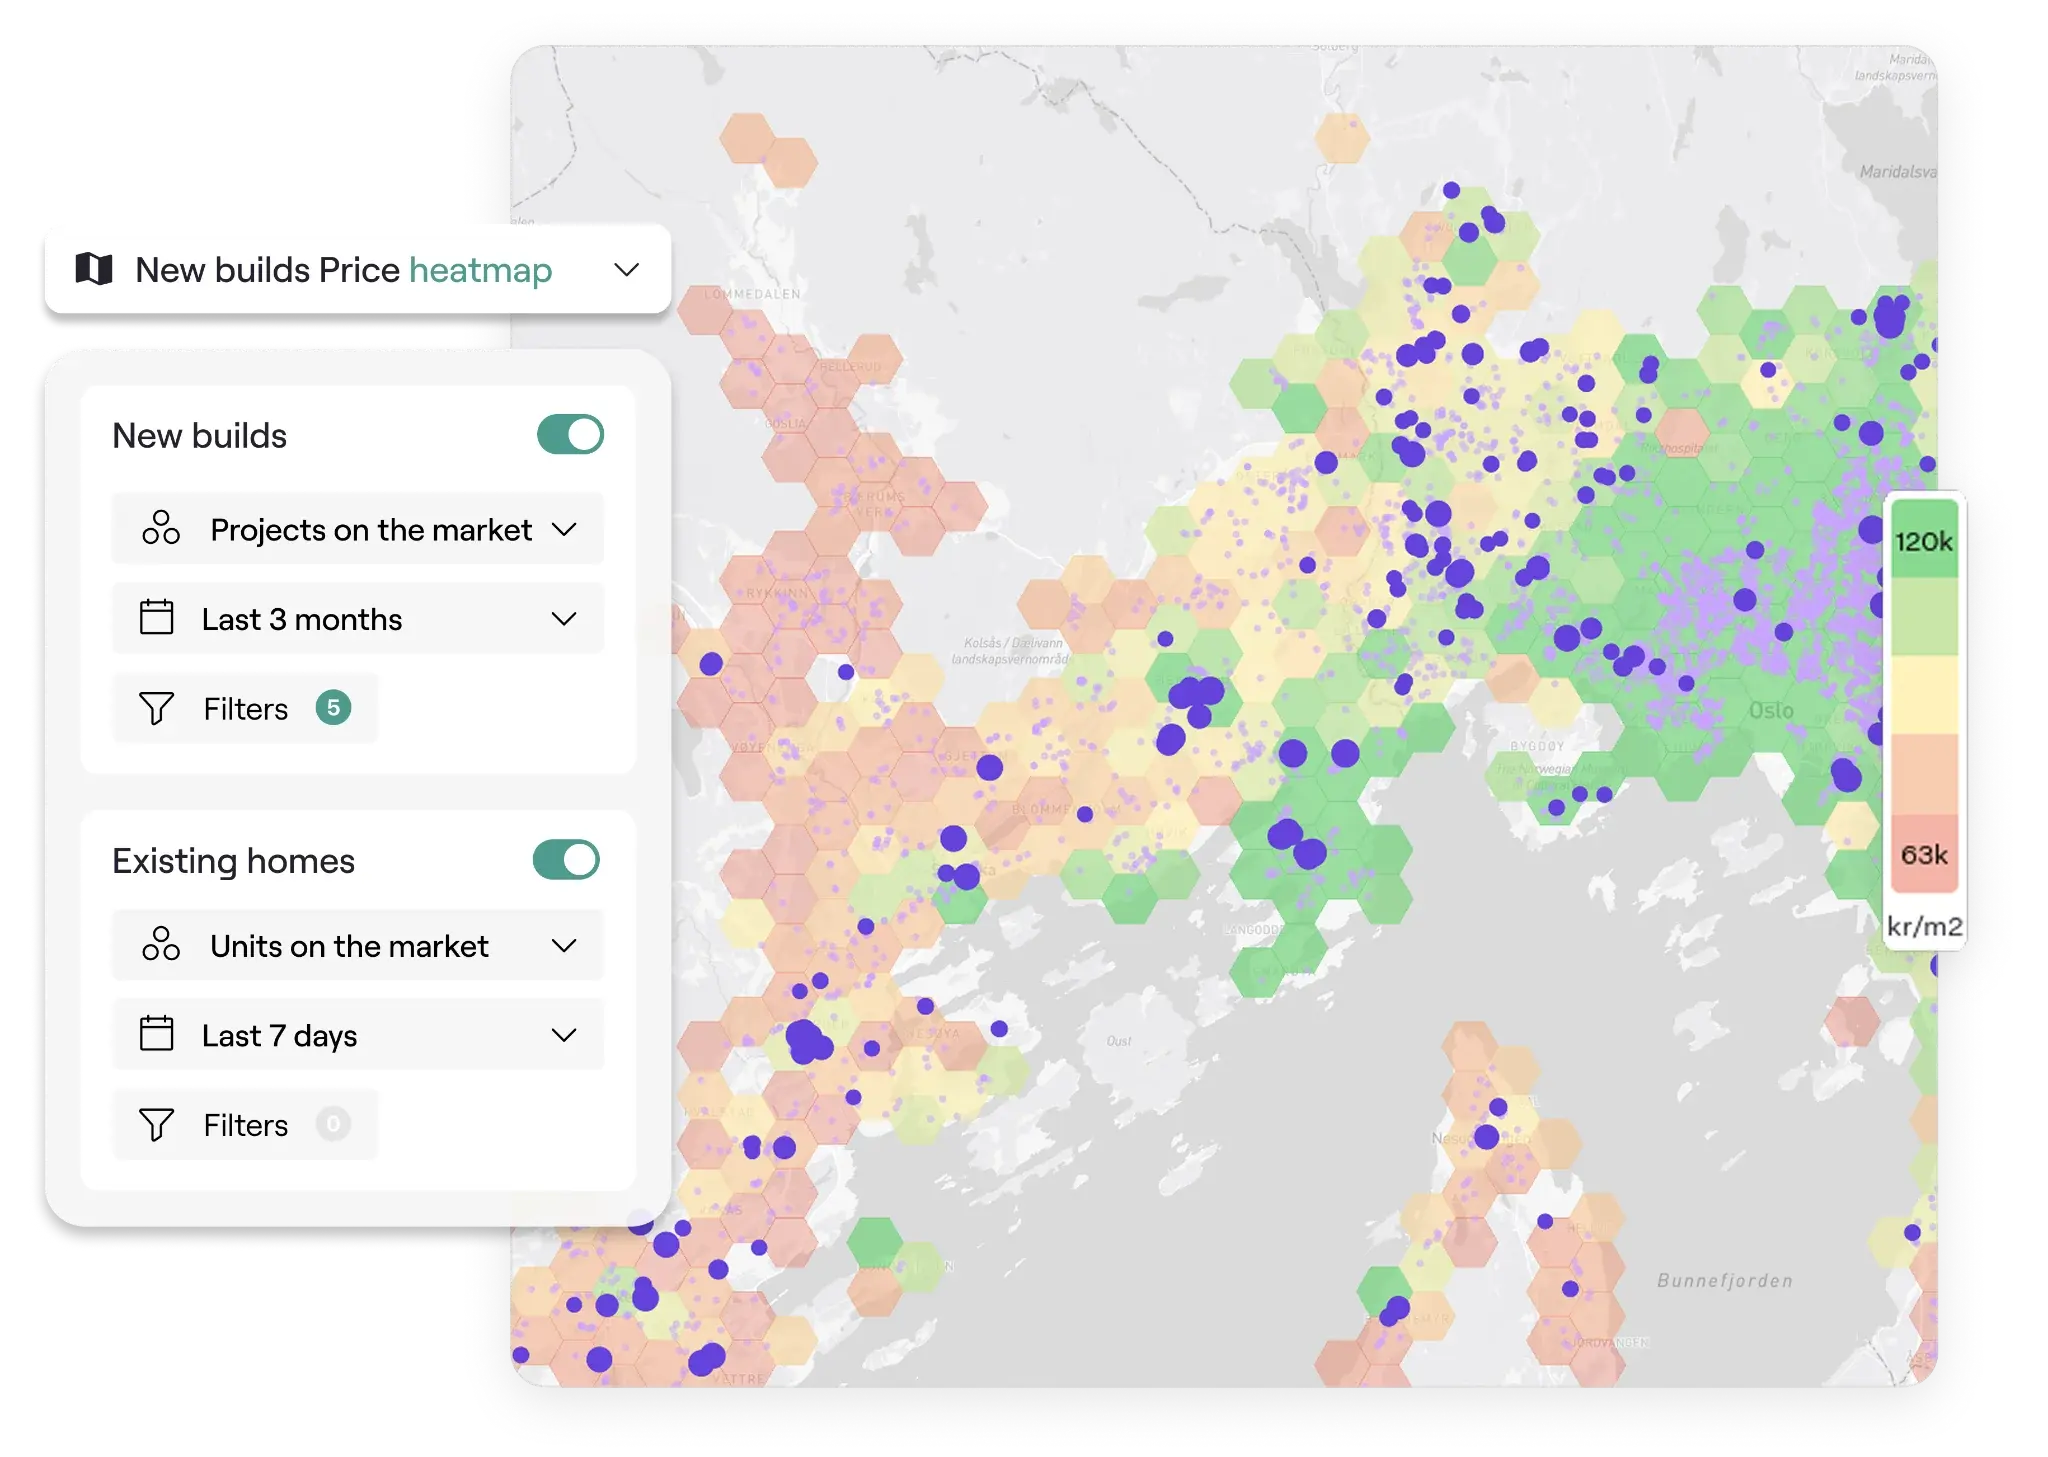 Plot.ai
Property data used in real decisions.
The reference concerns Plot.ai. It does not evidence use or outcomes of the Manta brain.EXAMINE THE PRODUCTS
Newbuilds presents products for insight, sales, visualisation and buyer follow-up throughout the project lifecycle.
Explore the product02 / PRODUCTPlot.ai brings property and market data together for analysis, pricing and project assessment.
Explore the product03 / PRODUCTJourney presents workspaces for buyer choices, approvals, documentation, inspections and follow-up.
Explore the productSources reviewed on 8 September 2026. The product reference above concerns Plot.ai. This website’s demo uses fictional data.
MEASURED IMPACT
Choose one process, period and source for the current result. Identify how data quality, seasonality and market changes could affect comparison.
Record what was proposed, approved and actually completed. Link each action to an owner and a date.
Measure activity separately from business outcomes. Show whether changes can be attributed to the action and what else might explain them.
THE WORK AND THE ECONOMICS
Agree what should improve, then measure the outcome after the work is done. Include the cost of delivering the change.
Stronger evidence before acquisition
Costs and assumptions resolved before bidding
Avoid pricing land on incomplete project evidence
Automated marketing and sales
Cost per contract, achieved prices and sales pace
Use sales budgets better and track tied-up capital
Quote and invoice reconciliation
Resolved deviations and actual final cost
Identify costs outside the agreed delivery
Controlled upgrades and handover
Net upgrade margin, errors and rework
Protect the contribution through actual delivery
Warranty follow-up
Cost per case, handling time and repeated errors
Resolve cases more efficiently and prevent recurrence
The examples show what can be measured. They are not evidenced Manta results. Financing, other delivery costs and the Manta fee belong in an assessment of net value.
THE VALUE LEDGER
Assumptions, source and owner are recorded. Impact has not yet been measured.
What needs to be true for the estimate to hold?
The action is complete and a change observed. Seasonality, market conditions and other actions may also contribute.
What else might explain the change?
The agreed measurement method is applied. Evidence, attribution, costs and possible double counting are reviewed by the owners.
What can be evidenced, and with what uncertainty?
EXAMINE YOUR OWN SCENARIO
Build an arithmetic scenario for a single period. The calculator shows a possible net contribution from three scoped value drivers, not a forecast or evidenced impact.
FOR THE CEO AND CFO
Review one development or an entire portfolio. Separate profit improvement, internal effort and released capital. Include the full cost of delivery.
All profit entries cover the same year. Enter expected effects after other variable costs.
Estimates are your assumptions, not prices or promised results from Newbuilds.com.
NOK 10.0m in benefit less NOK 6.5m in total cost.
Released capital is not added to profit. Financing impact requires timing, interest rates and the actual payment schedule.
Avoid counting the same benefit twice. Released hours are capacity until they reduce costs or create measurable contribution. Tax and discounting are not modeled.
12YOUR PORTFOLIO
Bring a land review, sales challenge or cost workflow. We review what Manta can prepare, execute and follow up in your setup.
Book a demoExplore the first deliverable